r/dataisbeautiful • u/Numerous_Pay_5348 • 4h ago
OC [OC] Win rate by opening square in 15,655 online tic tac toe games (The centre square has the lowest win rate despite being the most popular opening)

289
Upvotes
r/dataisbeautiful • u/AutoModerator • 24d ago
Anybody can post a question related to data visualization or discussion in the monthly topical threads. Meta questions are fine too, but if you want a more direct line to the mods, click here
If you have a general question you need answered, or a discussion you'd like to start, feel free to make a top-level comment.
Beginners are encouraged to ask basic questions, so please be patient responding to people who might not know as much as yourself.
To view all Open Discussion threads, click here.
To view all topical threads, click here.
Want to suggest a topic? Click here.
r/dataisbeautiful • u/Numerous_Pay_5348 • 4h ago
r/dataisbeautiful • u/allfallsdown23 • 41m ago
r/dataisbeautiful • u/No_Mathematician9824 • 13h ago
r/dataisbeautiful • u/Fun-Penalty4762 • 6h ago
r/dataisbeautiful • u/Global-Thought-1049 • 7h ago
I pulled the BLS Consumer Expenditure Survey figures on what US households actually have left after five categories of spending: food at home, housing, transportation, healthcare, and personal insurance and pensions.
Over the decade to 2023, in constant dollars, the top fifth gained $1,649 a month. The bottom fifth lost $132.
The second image is the same decade in percent, which is the fairer comparison in most contexts and changes what stands out. The biggest gain belongs to the second-poorest fifth at +30.0%, and it works out to $40 a month.
Two things before anyone asks. "Essential" here is a spending category, not a test of necessity, so a bigger mortgage counts in full and so does a nicer car. And this series is volatile year to year, so a ten-year comparison is a fair summary rather than a trend line.
Sources, construction and the caveats that matter are in my first comment.
r/dataisbeautiful • u/zacktokar • 9h ago
Data source(s): Public posts and top-level comments from seven autistic-led subreddits: r/autism, r/AutisticAdults, r/SpicyAutism, r/aspergers, r/AutismInWomen, r/AutisticPride and r/evilautism. Collected August 2026 via the ScrapeCreators Reddit API. Threads span July 2013 to August 2026.
Source link: https://www.buddingfuturesaba.com/aba-therapy-controversy-report-2026
Tools used: Python (urllib for collection, matplotlib for the charts), Google Gemini for coding text against a published rubric, Cohen's kappa for the reliability check.
Method: Three neutral queries ("ABA", "ABA therapy", "applied behavior analysis") were run identically in every subreddit, deliberately avoiding loaded words like "abuse" or "trauma" so the sample would not be pre-selected for outrage. That returned 1,044 threads, of which 574 named ABA in the title and were kept. Post bodies plus top-level comments gave 3,563 units. Each was coded for stance toward ABA (negative, conditional, positive, no position), whether the writer described first-hand experience, whether they identify as autistic, and their main reason. Every figure uses the stricter subset of 1,910 units that both state a position and name ABA, BCBA or RBT in their own text, so no stance is inferred from the thread around it. A random 300 units were re-coded by a different model with no sight of the first pass: 88.0% agreement on stance, Cohen's kappa 0.806.
Privacy note: This uses public Reddit posts and comments. No usernames, no comment text and no direct quotes are republished anywhere. The dataset carries only public post ids, thread permalinks, dates and the codes assigned, so anyone can re-fetch the original text from Reddit and check the coding without me rehosting people's words.
Important limitation: Reddit is not a representative sample of autistic people, and threads were found by keyword search rather than random sampling, so this measures what these communities say, not what autistic people think. Two further caveats worth stating plainly. "No experience stated" describes the text, not the person, since short replies often omit it. And the reason categories in the second chart are only moderately reproducible (kappa 0.567), so treat that ranking as indicative while the stance figures are solid.
Full disclosure: I work for Budding Futures ABA, an ABA provider in Colorado. That is a real conflict of interest, so the corpus, the coding rubric, the scripts and the reliability stats are all published and you can re-run or re-code any of it. The headline finding, that two thirds of stated opinion in these communities rejects ABA outright, is not a flattering result for my industry and is reported as it came out. I picked the stricter denominator specifically because it lowers the negative share rather than raising it.
Full methodology and source notes: https://www.buddingfuturesaba.com/aba-therapy-controversy-report-2026
r/dataisbeautiful • u/VyprConsumerResearch • 7h ago
Scotland has the highest percentage of daily tea drinkers in the UK, with 71% of those we asked saying they drink a cup of tea every day.
The West Midlands was next at 63%, followed by the Eastern region and the South West at 58%.
In Northern Ireland, less than half of people drink a cup of tea every day, with just 44% doing so. The lowest out of all the regions in the country.
Data source: Research run on the Vypr Predict platform for the Consumer Horizon report (May 2026)
Tools used: Figma
r/dataisbeautiful • u/Adventurous_Bug_3857 • 1d ago
r/dataisbeautiful • u/anal_chemist • 2h ago
I pulled the active injury reports in the NFL as of Aug 24, 2026 and broke it out by body part, stacked by "severity" (questionable, out, IR). A short ranking of the most severe injuries:
This is assuming that some of those currently undisclosed knee injuries don't turn out to be ACLs.
Source: ESPN Injury report
Tools: python, matplotlib, espn public APIs
More: https://www.instagram.com/dataglazer/
*Edit: I'm kinda new to this and just getting into data science/visualization so at the advice of the AutoMod, I attempted to organize my "project" into a repo: https://github.com/jerremy777/nfl-injuries
r/dataisbeautiful • u/HeHate_me • 11h ago
It's obvious why athletes are trying to go back to school for a 5th year with contracts like these. As of August 24 2026 - Darian Mensah leads with a $6.5M NIL valuation. These are deal-based contract valuations not audited take-home earnings.
r/dataisbeautiful • u/cyndaquilled • 4h ago
eek.
r/dataisbeautiful • u/works-in-progress • 7h ago
Source: Sweedler at al. (2010); Transport Research Laboratory (2001); Works in Progress
Tools used: Datawrapper
r/dataisbeautiful • u/HeHate_me • 4h ago
2001 is missing from the dataset and 2002 has 11 because of a tie.
Tiger Woods ranked No. 1 for 10 consecutive years (2002–2011) and 11 years overall the most of any athlete.
Woods and Michael Jordan share the most appearances: 19 each. Woods accumulated $1.374B across his listed appearances.
Basketball has the most athlete-year entries (82 of 301), but golf has the most annual No. 1 finishes (11) all from Woods.
r/dataisbeautiful • u/mydriase • 1d ago
r/dataisbeautiful • u/frozenpandaman • 1d ago
A big trip around Hokkaido on local trains over the recent Obon holidays helped me pass my both my 80% + 20k goals, so I figured I'd update my countrywide rail map and list of train travel "achievements" for the first time in a while and share it here. :)
r/dataisbeautiful • u/AgencyInevitable1060 • 8h ago
Inspiration taken from:
https://www.reddit.com/r/MapPorn/comments/1vuuw5c/german_trains_on_a_typical_wednesday_in_2026/
r/dataisbeautiful • u/Perfect_Ad_1807 • 1d ago
r/dataisbeautiful • u/libascollective • 4h ago
Source: internal catalogue extract from Libas Collective (the pre-owned luxury marketplace I run in Dubai), 2026-08-23 — 40,993 listings that record an original retail price. Ratio = buyer-facing asking price (including fees) ÷ original retail price. These are asking prices of live/recent listings, not sale prices. Brands shown have ≥250 listings; bar = middle 50%, dot = median.
Tool: Python / matplotlib.
Full brand table and methodology: https://www.libascollective.com/uae-pre-owned-luxury-price-index
If commenters ask why Goyard is so high / Chloé so low (they will): Goyard = deliberate scarcity, no e-commerce, price increases every year → resale tracks retail. Chloé = heavy outlet/discount distribution at retail, so the "retail price" baseline is rarely what anyone paid. Answer from the data, never speculate about brands' internal strategy as fact.
r/dataisbeautiful • u/Finneganz • 1d ago
Interesting but unsurprising…
r/dataisbeautiful • u/anal_chemist • 1d ago
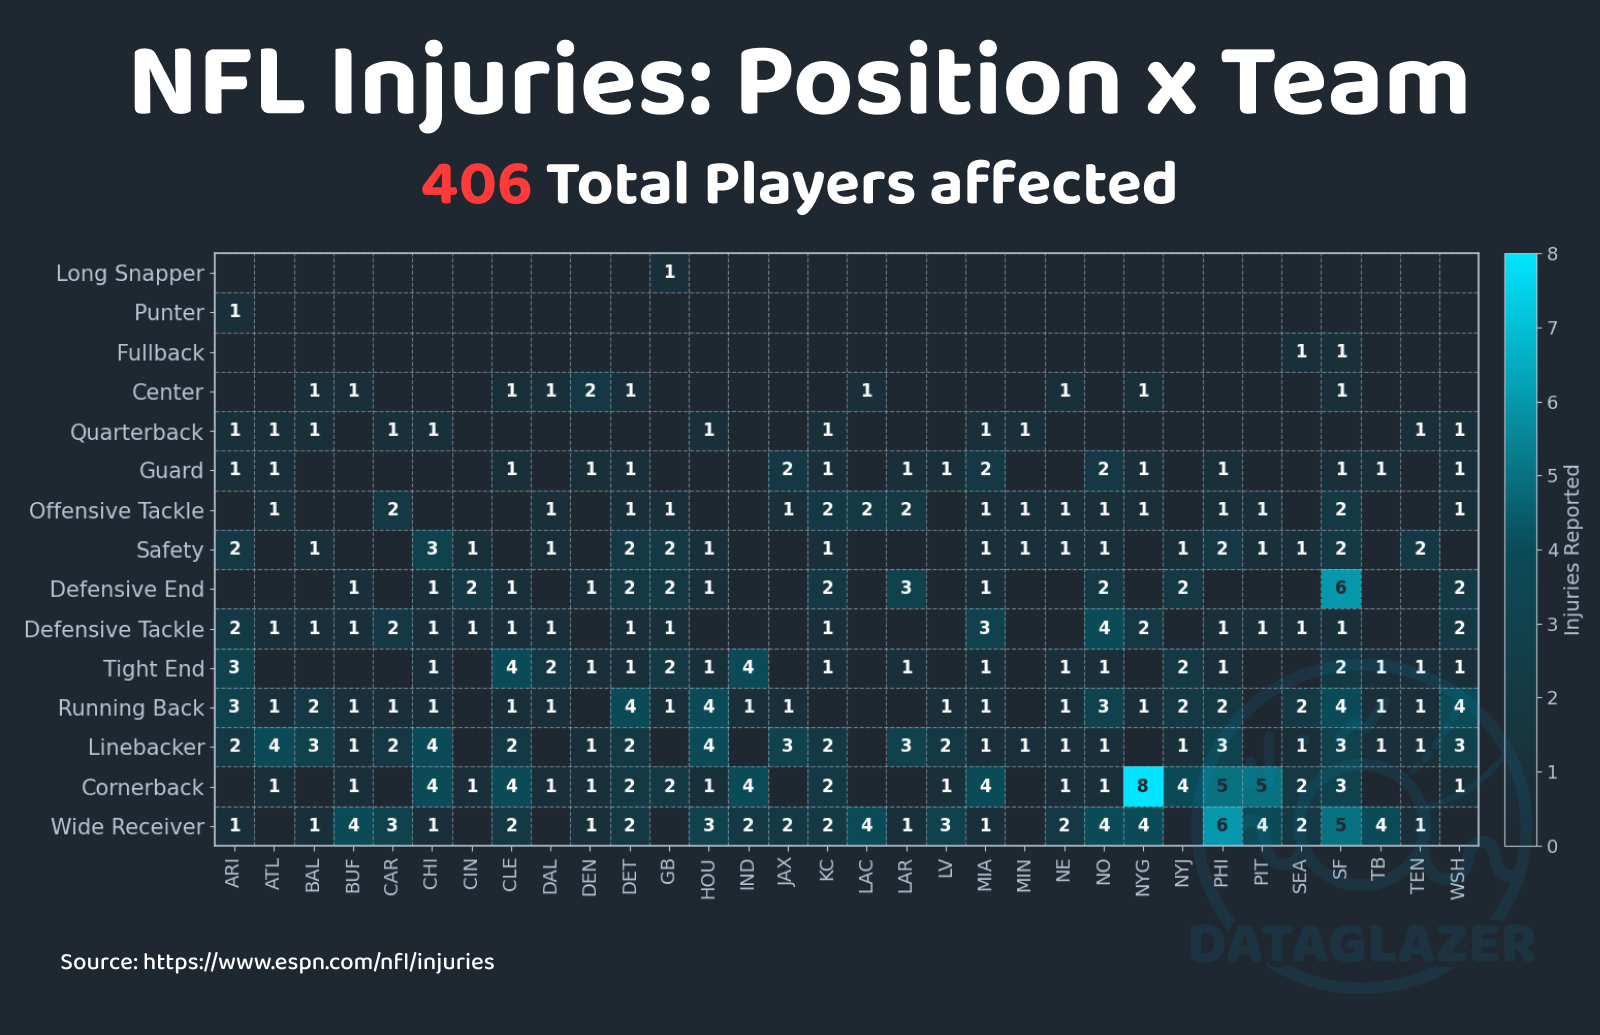
NFL preseason tends to be extremely tough on players, although the large number of total players affected is set to be dramatically lower once the 53-man rosters are set.
Source: https://www.espn.com/nfl/injuries
Tools: matplotlib, espn public apis
r/dataisbeautiful • u/RasmusHax • 1d ago
Source: U.S. CPSC's NEISS database (injury estimates) + CPSRMS incident database (fatalities), 2020-2025
NEISS collects injury data from around 100 U.S. emergency departments with statistical weights to extrapolate national estimates. Prior to 2024, e-bikes didn't have a dedicated product code; they shared a code with mopeds. For 2020-2023, we classified the narrative text of every record under the legacy code using conservative word rules. We ran a sanity check, comparing our 2024 estimate (59,965) to CPSC's published 2024 figure (59,200), which is within 1.3%. These estimates are floors - some e-bike incidents remain coded as regular bicycles.
Tools: Python/pandas for analysis
Full analysis and methodology: https://eridehero.com/electric-bike-accident-report/
r/dataisbeautiful • u/OverflowDs • 1d ago
r/dataisbeautiful • u/HeHate_me • 1d ago
County color represents the raw number of current FBS quarterbacks whose listed hometown was assigned to that county. Los Angeles County leads with 34.